SPARC Dashboard
Leverage your data into a strategic map of where you've been and where you can grow.
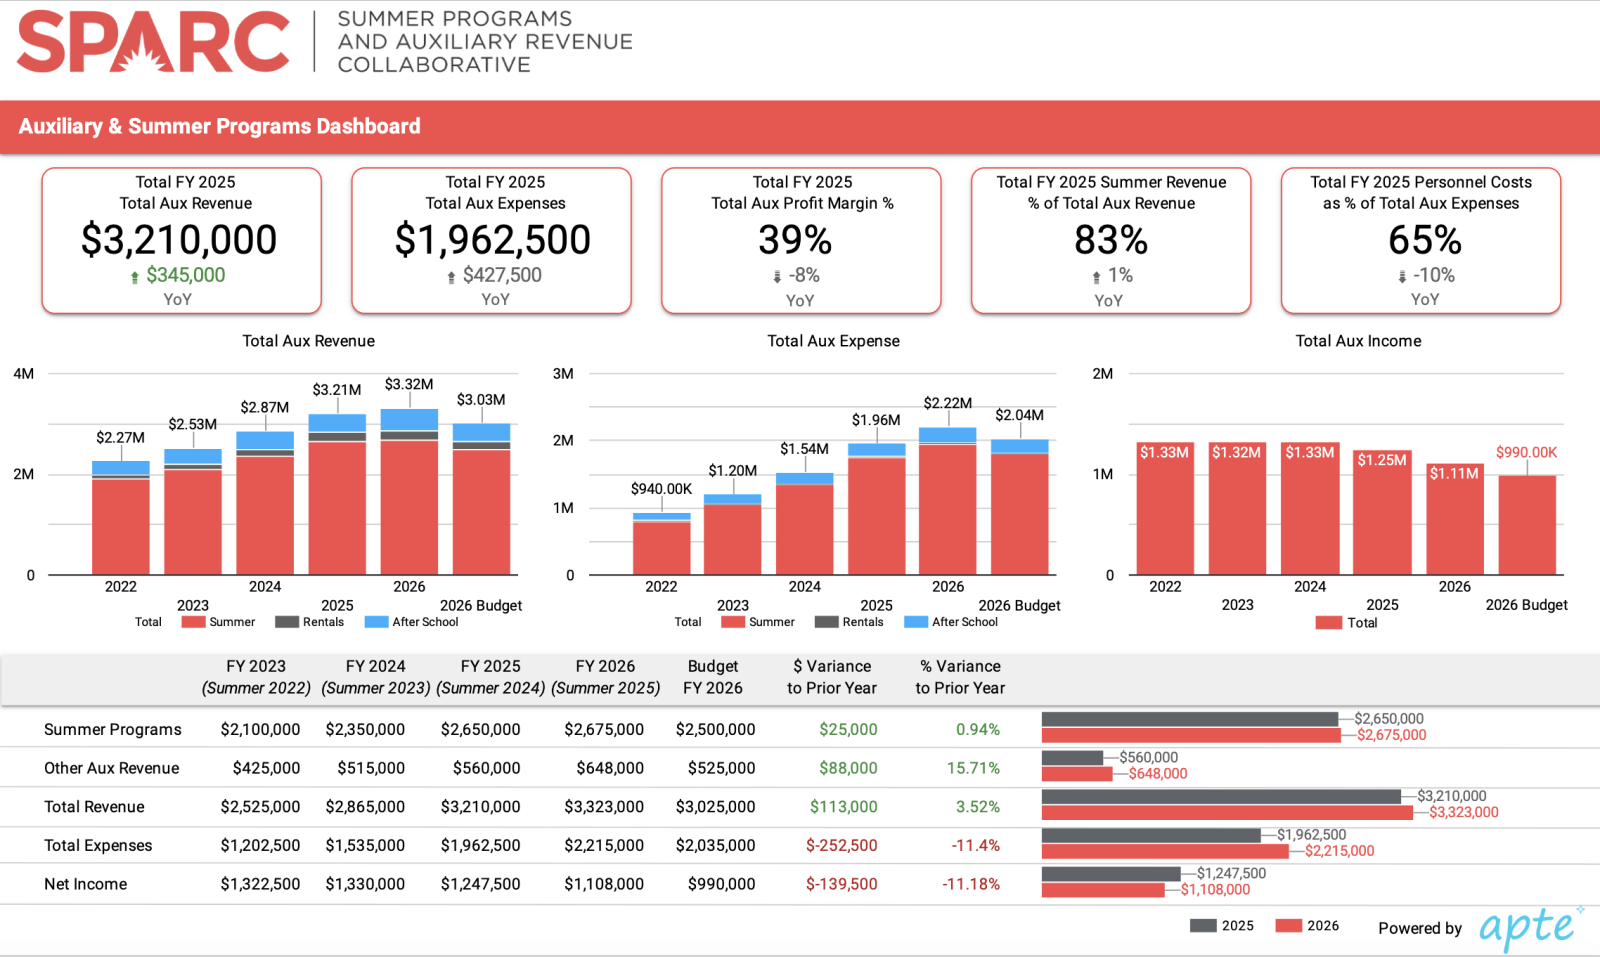
The SPARC Dashboard is an annual member benefit created expressly to help auxiliary program leaders turn spreadsheet data into clear, high-level visuals that support strategy and storytelling. Independent schools increasingly use dashboarding across departments to communicate performance to CFOs, heads of school, boards, and internal teams. Many auxiliary leaders don’t have the time or tools to design these visuals from scratch, so SPARC, in partnership with independent-school data specialists Apte, created a standardized yet flexible dashboard you can use year after year.
Each fall, auxiliary program leaders submit fresh information during the submission window. Apte then creates and sends a high-level, standardized, school-specific PDF that makes it easy to track your own auxiliary trends over time and communicate impact. The SPARC Dashboard:
- Clarifies complex spreadsheets into visuals decision-makers understand
- Surfaces trends (growth, capacity, profitability) to inform strategy and budgeting
- Provides a common, repeatable, annual artifact for upward and cross-functional communication
Each school’s information is treated with the utmost confidentiality and is used to show trends that help inform planning, staffing, budgeting, and communications. The SPARC Dashboard adds significant value to your work and supports more strategic conversations with school leadership.
To learn more, visit the SPARC Dashboard folder in the Resources section of SPARC Connect. There you will find a thorough description, access guide, a recording of our introductory webinar, and a sample Dashboard.
“Dashboards make data visible, understandable, and actionable. When schools can clearly see their trends and performance, they are able to make faster, smarter decisions. Tools like the SPARC Dashboard help transform data into clear insights for school leaders.”
- Kaitlin Windle, Founder & CEO, Apte
"Anyone who is in this field should be joining SPARC as it seems to be the only space that truly focuses on what we do, and supports our endeavors."
Ida Dahan, Director of Summer School and Enrichment Programs, Marlborough School
Featured on the Career Center